->Both rovers are providing data about Mars atmosphere. These data are mostly yielded by the Miniature Thermal Emission Spectrometer (Mini-TES). Mini-TES is associated to PanCam's mast and is usually used for identification of rocks and soils from afar. It may be used too to study Mars' atmosphere. Such studies may be performed in conjunction with NASA Mars Global Surveyor orbiter: as rovers take measurements from Martian ground, orbiter does them from orbit. Such atmosphere studies usually last less than 20 minutes and easily fit into rovers schedule. Rovers are providing a unique opportunity to make science about Mars atmosphere lowest layers. This critical region -there where atmosphere interacts with the surface- is difficult to study from orbit. That's why rovers studies are of interest
Atmosphere science is provided by rovers atmospheric teams. Such teams are working about their own field but are providing other science teams with data too (e.g. about quality of light: how the atmosphere is when observations are performed, at what degree is it smoggy, etc). Atmospheric teams are working to get a comprehensive view of Mars climate. Future exploration missions will need such data about their environment: what conditions will the machines have to be prepared for? Is dust a problem? What are temperature extremes?
->Atmosphere scientists are harvesting data about four elements mainly:
- Air Temperature. Air temperature may be probed with the Mini-TES up to an height of 1.2 miles (2 km) providing first real data about this near-surface area. This is of importance as all other major Mars climate systems are in interaction with this lowest area
- Water Vapor. Air humidity is lower on Mars than on the Earth (Earth has about 10,000 more water in its atmosphere than Mars). Water vapor is considered a key part of daily climate and may give clues too about the question of water underground layers
- Water-Ice Clouds. Water vapor freezing in the high atmosphere forms cirrus-like clouds. Science about these clouds may provide additional data about how water is exchanging between Mars surface and atmosphere. As seen from the surface, data may be obtained in more details than from orbit
- Dust. Mars is litterally covered with fine, powder-like dust. It may form dunes and ripples. Dust is a concern for solar panels-produced energy
Atmosphere Composition
Dust
Dust Devils
Atmosphere Temperature
Clouds
| click to Mars atmosphere composition. graph courtesy NASA/JPL/Arizona State University |
![]() Atmosphere Composition
Atmosphere Composition
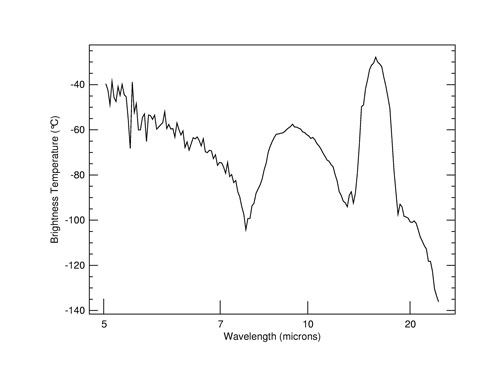
Some data are showing what is usually thought about Mars atmosphere: in the graph below three peaks at 6, 9, and 15 microns are respectively matching dust, water vapor and carbon dioxide. These are the main elements of Martian atmosphere
![]() Dust
Dust
The rovers landing by early 2004 coincided with the end of a large dust storm. Such a regional event yielded an opacity of 0.9 (the higher the number, the dimmer the sky; the value assessing the opacity is characterized "tau"). A normal value should be about 0.5. In the midst of a localized, small strom, opacity may jump up to 1.25. Another indicator of dust at Mars is how the calibration targets installed on both rovers were coated with dust. Along one year (picture left), it appears that Opportunity (bottom), at Meridiani Planum, was less dusted than Spirit (top, a 70 percent more dust) at Gusev Crater, likely due to more winds blowing or frost agglomerating dust and easying it away. Between 1 and 10 micrometers (1/100th to 1/10th a human hair width) has been found on the rovers after one year exposition. Calibration target is 3.15 inches (8 cm) in diameter. Pictures center are showing general views of each rover in February 2005. There too, Opportunity (right) is appearing less dust-covered than its twin. How objects are affected by dust at Mars may be modified however, as frost, or wind, may aggregate dust or clean it up off the rovers (picture right). The 'cleaning events' both rovers are regularly enduring are leading to welcome maintenance of the power sources! Most cleaning events are sudden as one has been seen lasting up to 50 Martian days!
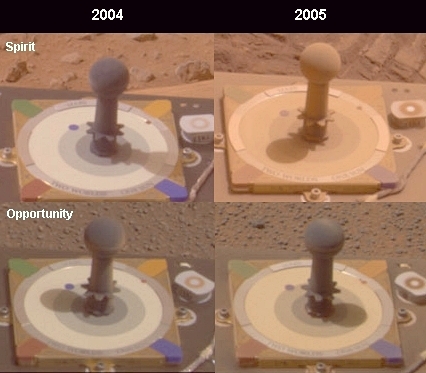 |  | 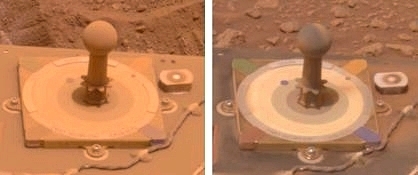 | 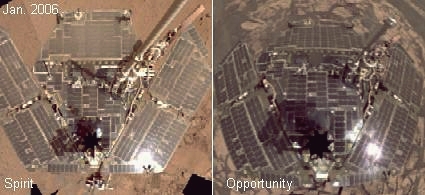 | These views are showing how rovers have been affected by dust. From left to right: how rovers are dust-coated after one year at Mars, how the rovers were looking like in Feb. 2005, how dust was removed at Spirit on a timespan of 10 days in March 2005, how the rovers were looking like in Jan. 2006. pictures 1 to 3 site 'Amateur Astronomy' based on pictures NASA/JPL/Cornell; 4-5: pictures NASA/JPL/Cornell; 6-7: site 'Amateur Astronomy' based on pictures NASA/JPL-Caltech/Cornell |
![]() Dust Devils and Dust Events
Dust Devils and Dust Events
Martian dust devils are this spiraling columns of dust which are traversing the landscape where they are occurring. Dust devils are triggered by a mix of dust, wind , and convection (the Martian surface is warm, as the air is chilly as soon as 6 ft (2 meters) above). It might that these small cyclones are seasonal and perhaps linked to storm winds which are appearing with the Martian springs. Dust devils at Mars are usually considerably larger than at Earth. They may reach 500 yards (500 m) wide and a few miles high (several thousand meters) as their terrestrial counterparts are about 10-100 m wide only (with winds circling the warm air column at about 20-60 mph (32-96 kph). Martian dust devils are an important erosion factor. They are transporting large quantities of dust. Dark track patterns are commonly found in many Mars regions and are changing from season to season. Dust devils at Earth are featuring large electric fields in excess of 4,000 volts/meter or more, and magnetic fields. It is still unsure, but likely, that Martian dust devils have these same characteristics. One dust devil seen by Spirit was estimated travelling at 16 feet per second (4.8 meters per second). see more about the hazards Martian dust devils might cause to manned expeditions
Other dust events seem to occur at Mars too, like dust gusts or whirlwinds
As far as the Twin Rovers are concerned, Spirit only, at Gusev Crater, saw dust events. Dust devils since about April 9th, 2005. Two of them first, then a lot, and eventually several ones into a same field of view. Spirit in May, saw other dust events. see the movies below
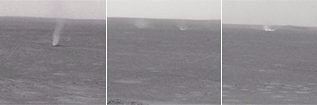 |
the views above of various dust events at Gusev Crater are extracted from movies taken by Spirit.
.click to a movie of a dust devil (601 ko)
.click to a movie of several dust devils (607 ko)
.click to a movie of dust gust (534 ko)
.click to a movie of dust gusts and whirlwinds (575 ko)
you will have noted that the movies are large to download; on the other hand, they are dark
movies (from top to bottom) NASA/JPL, NASA/JPL, NASA/JPL/Texas A&M, NASA/JPL/Texas A&M
![]() Atmosphere Temperature
Atmosphere Temperature
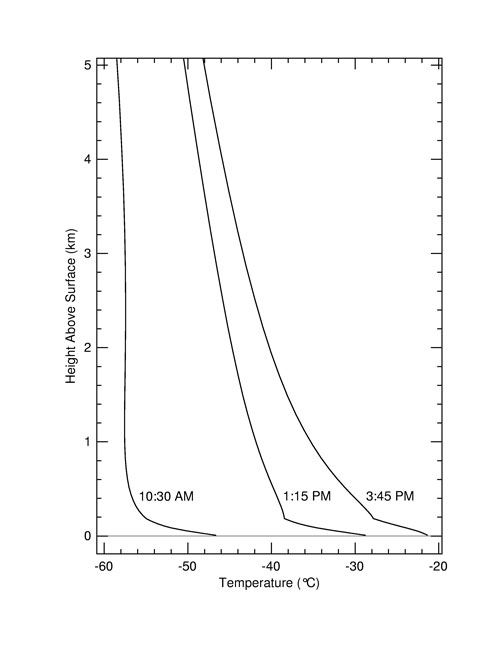
Some general data first are showing a general view of Mars atmosphere temperature range -up to 80 km (blue is a theoretical model, red data during a rover's entry); Mars atmosphere temperature range up to 16 km (data by Opportunity Mini-TES from ground and Mars Global Surveyor from orbit); one day temperature evolution at Spirit landing site (blue is for first day of the mission; yellow is 100 martian days latter, i.e. as Mars southern hemisphere is heading autumn, hence colder); and a graph of the seasonal temperatures variation at 328 ft (100 m) above Martian surface at Opportunity rover site (the plot begins at late summer and runs until mid-winter; purple=early morning, green=midday, red=late afternoon; temperatures in deg;K. 74 on the horizontal axis is Mars' aphelion -or late fall-beginning of winter; data rover's Mini-TES). The same plot might be drawn for temperatures at higher regions of the atmosphere (3-6 miles (5-10 km) or above 16 miles (25 km))
 | 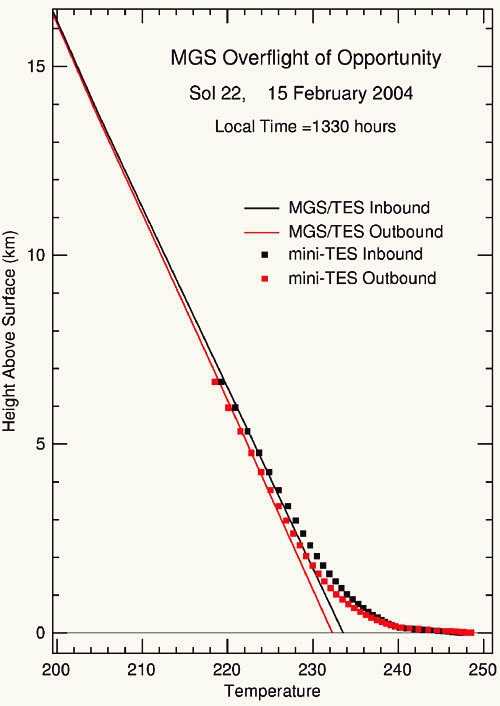 |  | 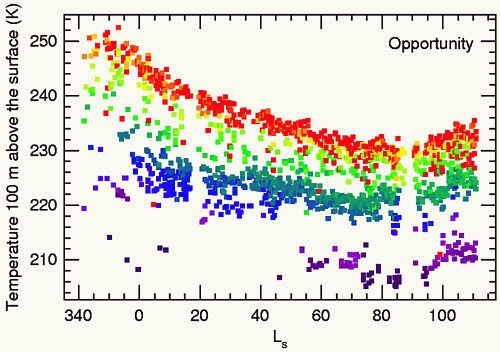 | from left to right: Mars atmosphere general view, Mars atmosphere up to 16 km, one day temperature changes at Spirit landing site, seasonal temperature variation at Opportunity site. (courtesy (from left to right) courtesy unknown, NASA/JPL/Goddard/ASU/Cornell, NASA/JPL/ARC/New Mexico State University, NASA/Goddard/Arizona State University, NASA/JPL/Cornell/ASU/SSI) |
Other data about Martian atmosphere lower layers are interestingly showing that air is enduring rapid temperatures changes there. Changes may range several degrees up and down within a minute. They seem to be due to warmer and colder blobs of air intermittently passing over. Gliding community knows these air blobs well as "thermals" allowing gliders to sustain or to gain altitude. More generally as day is unfolding, warm air is bringing heat to upper layers where it yields an overturn
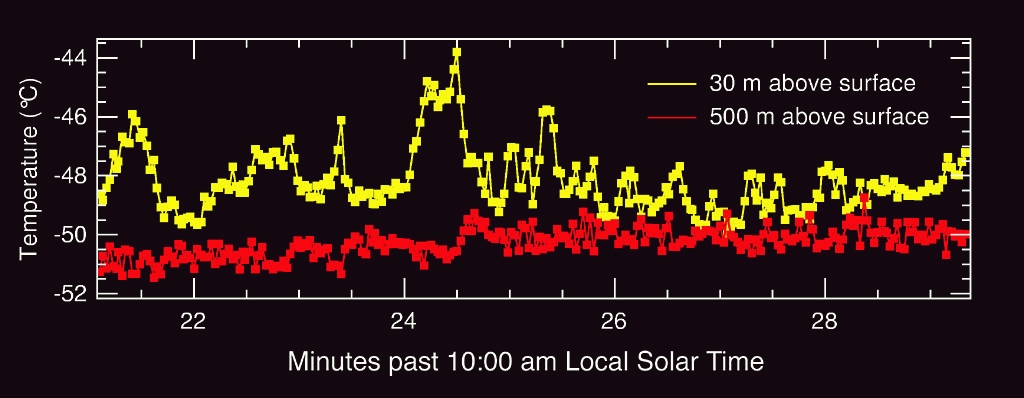 | 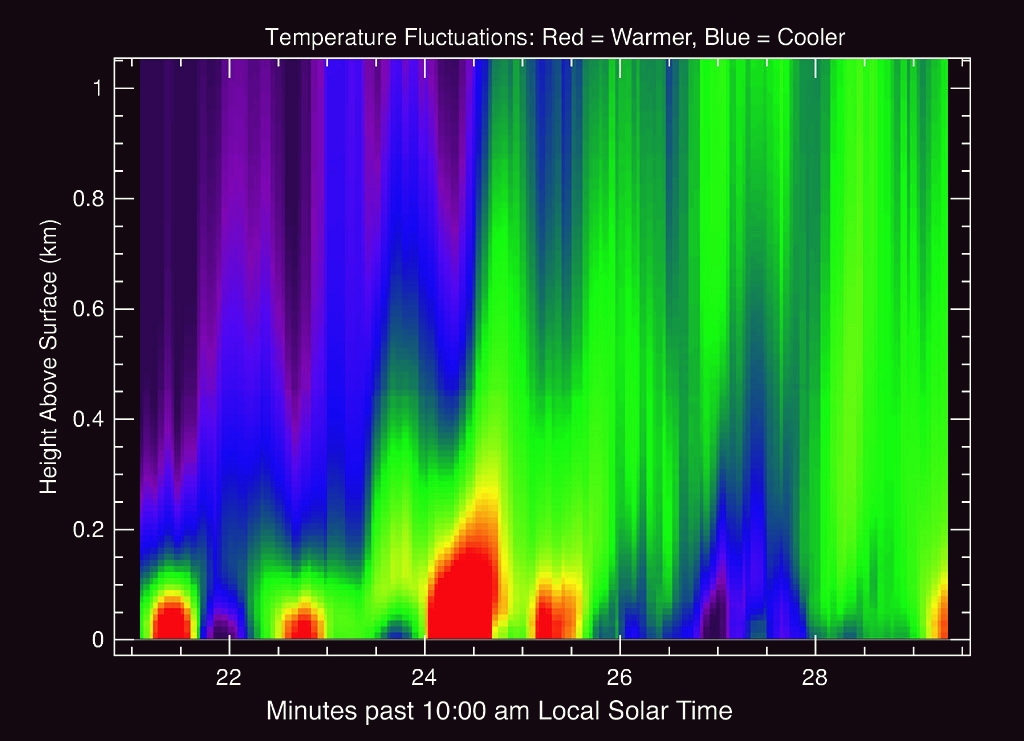 | Mars atmosphere lower layers temperature changes(left), Mars atmosphere lower layers air blobs (right). pictures courtesy NASA/JPL/Cornell/ASU |
Such low layers studies are of importance as they bring a better undestanding of Mars' winds, showing interactions between atmosphere low and higher layers. Global winds are working in the latter. Another interest of these studies is that they are providing more data about wind's role in Mars geological formations. Wind might well be the most important agent of change on Mars. This understanding of Martian winds will allow too a better assessment for next landings. Two graphs above, taken at Gusev craters, are showing air changes and air blobs in atmosphere's lower levels
 | click to Mars atmosphere temperatures. graph courtesy NASA/JPL/Arizona State University |
Another graphs is maybe more innovatingly showing that changes in temperature at Mars surface or immediately above are still found high in the atmosphere even if range in this latter part is smaller than at the surface
As water vapor is moving from the north pole to the south pole when it's northern summer and southern winter, this yields clouds at places like Meridiani Planum, South of the equator. This further adds to the usual pattern of clouds which exists as a band near the equator when Mars is near the part of its orbit farther from Sun, that is when it's the beginning of winter South. This phenomenon occurs when Mars is farther on its orbit from the Sun, that is, South, late fall-beginning of winter. The current of water vapor from the northern polar regions combines then with lowered atmospheric temperatures. At this same season, the conditions are different more South from the equator. Water vapor is reaching, South, at any latitudes, a maximum near the spring equinox but the atmospheric temperatures having warmed then prevent the formation of cirrus-type clouds. As clouds during winter are forming 3 to 6 miles (5-10 km) high at the equator, they are forming -in a lesser quantity- at an altitude of 16 miles (25 km) at other moments of Mars' year. There is considerably less water vapor there
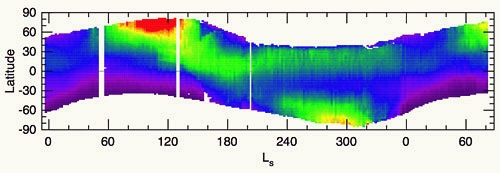 | this graph is showing the sasonal variation of water vapor at Mars (the plot is beginning near the beginning of fall South. 74 on the horizontal axis is Mars' aphelion -or late fall-beginning of winter. Purple is no water as red is 50 precipitable micrometers (about 10,000 times less than at Earth; data Mars Global Surveyor thermal emission spectrometer). During the southern winter, motion of water vapor from Mars' north pole to the south pole is producing more clouds just south of the equator, plus low temperatures near the surface, which may even bring frost. graph NASA/JPL/ASU/GSFC |
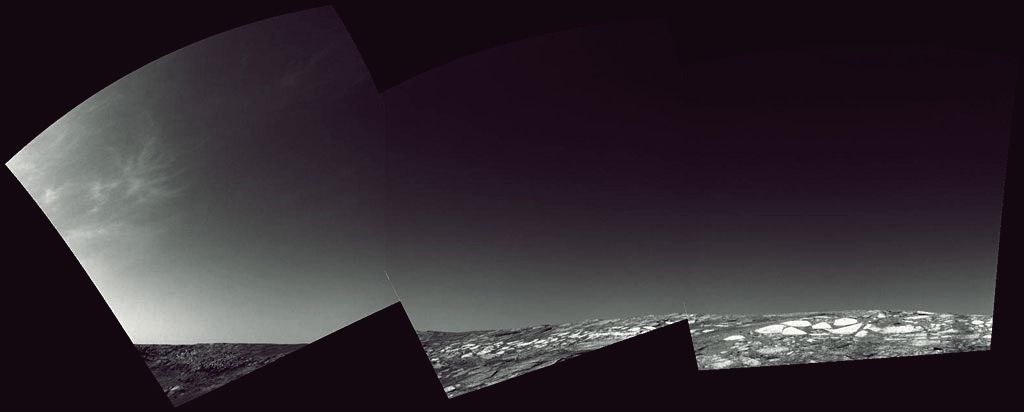 |  | 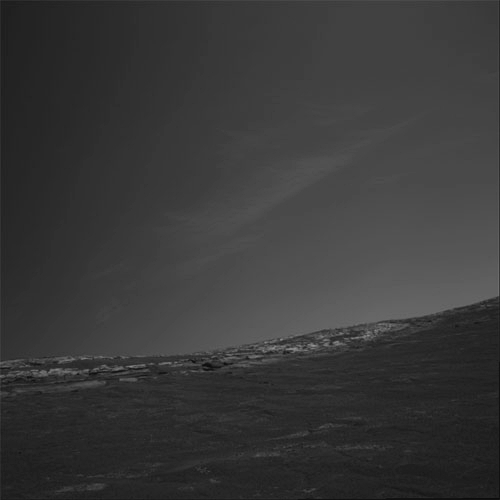 |  | click to views of Martian clouds. from left to right: clouds at Endurance Crater, winter clouds at Endurance Crater, cirrus (1 and 2) at Endurance Crater. pictures courtesy NASA/JPL, NASA/JPL/Cornell, NASA/JPL, NASA/JPL |
 | click to a view of evolving clouds at Endurance Crater, along one martian day. Both views span from east (left) to southwest (right). pictures courtesy NASA/JPL, top, NASA/JPL/Cornell, bottom |
