Amateur astronomy is often a pleasure as it may be too a way to act scientifically. An easy way to begin in that latter sense is first to set the observatory well, and then to take the habit of writing down observation reports, as this way to do may improve skygazing like a pleasure too. Your observation reports, on the other hand, time passing, will be useable as a recollection of your observations or, in the direction of a science attitude, they'll represent the beginning of a database. That altogether may take the form of some gabarit observational sheet which you will use for each observation. Making a sketch of what you observe is about mandatory. Function of whether or not you are part of a amateur astronomy club or a amateur astronomy association online, you may or not have a specific, mandatory gabarit at your disposal. The amateur astronomy community for now is lacking any observation report standard as a whole. Planetary observation associations, like the A.L.P.O. further provide, for example, for special and detailed gabarits for such observation. What follows is a description of what is about practiced by most in the amateur astronomer community as you will of course adapt our advices with your personal choice, taste, and needs. Of note also is that the Internet provides for observation recording tools as a first question to ask before using such a tool is what its exportation abilities are in terms of the records you will have enter. It would be damaging to realize, after some years that you can't recover your observations in any format you want. A other question is whether that continuity will be exportable from a computer to the next one when you will buy, for example, a new computer
A good idea, first, is to accurately gauge your observatory, or observing location, might it be a sole balcony! It's useful in any case -and further if you use a computerized modern telescope. First, get the precise geographic coordinates for your site (this may be done through such softwares like Google Earth, for example). Then you can also spot where the cardinal points are, relative to your field of view (the luckiest of the observers will have all four at their disposals) that is, where the West, North, South, and East are. This will allow you to grossly locate an object, or a sight during an observation. This will too allow you to better use any astronomical software, for example, knowing how to match what the software displays and the real world sights. Altitude also is of use. That may first bring to a first set of data on your observational sheet, something like (data and values fictitious):
The next good idea is to make a accurate recension of the astromical telescopes you are generally using for your observations like a way to be able to build serious comparisons between observations, for example. So check for some location on the report for the telescope used. Generally, as you will use several magnification, or if you use more than one telescope, just write down all those characteristics on some paper, or file to be able to report that for each observation. For any telescope (binoculars included), that can take the form (idem):
Which translates at the observation report gabarit, with any more useful data you may deem necessary to report, like:
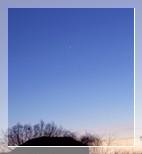 | Sky conditions at the moment of a observation are a important factor! picture courtesy site 'Amateur Astronomy' |
Once the observation station settings set, you will take care to assess observing conditions at the moment of any observation self. This aims at that your set of observations be later used and comparable, by yourself or other amateur astronomers as the observation report will feature those conditions. Observing conditions mainly concern the state of the sky at the moment of the observation. The trick is that, as three main conditions look like the most assessed by most astronomers, scales of those, per se, are much variable and down to ones specific to each amateur astronomer! We thus will describe hereunder three observation criteria with their scale, provided that you will consider that like a sample only and you will have to deepen any knowledge for you own use and further should you belong to a astronomy club (in that case, you will mostly use the observation conditions and scales in use there). In any case, you will of course not dedicate too much time to such a assessment with the best part of your time dedicated to observation!
Transparency. Denoted 'T,' transparency is a assessment of the transparency of the sky at the time of the observation. That is done through the determination of the less bright star which you can accede naked-eye. Transparency impacts what faintest celestial objects you can reach at during a observation. Some are advicing to use a series of stars around Polaris, or stars available at the time of the observation at the zenith. To get that, you will need a sky atlas or a sky atlas software from which you will quickly built a magnitude chart useable in the field onto which you will have written down the magnitudes of stars down to the 7th. This is true for about the center of a constellation located at the zenith at the time of your observation and also number the star from the weakest to the brightest in a series like a, b, c, etc. A good idea, for example, is to prepare a chart of Lyra, the Lyre, Cassiopeia, the Queen, Auriga, the Charioteer and Ursa Major, the Great Bear for your observations in summer, fall, winter and spring, respectively. Once in the field and your eye adapted to darkness, check the stars starting at the weakest of the series and until you are able to see one. The magnitude of that star is called the 'limiting visual magnitude naked-eye,' or 'Lvmn.' Thence varied scales come in play to attribute a scaling to the sky transparency. Here is one example scale
Such a scale may also be written from T0 (Lvmn 6.5) down to T5 (Lvmn under 4.5) with intermediate values at T1 (6.5-6.25), T2 (6.25-6), T3 (6-5.5), and T4 (5.5-4.5). Another scale is from 0/10 to 10/10 for example
Seeing. Denoted 'S,' seeing, or turbulence is a assessment of how the atmosphere is perturbed or not by density or temperature layers, or how atmosphere is blurring the view. Turbulence, generally, is a inevitable state of the Earth's atmosphere which has the stars scintillate at night as starlight is shifted in varied directions when journeying across the atmosphere. Seeing impacts the resolution of objects observed. It is usually adviced to assess seeing through how a moderately bright star is looking in your instrument and the concept of the 'Airy figure.' The concept of the Airy figure is due to diffraction through the atmosphere, and the quantum nature of light. A star then does not display in a instrument any real shape, like a tiny sphere for example but the Airy figure, a bright central spot or disk and concentric rings around, which are the more distant from the disk, the less bright. Here is a example of such a scale, which is determined looking at a focused, moderately bright star:
A alternate to the previous is the well known Pickering Seeing Scale, from William H. Pickering (1858-1938) (from the best to the worst seeing conditions):
Light Pollution. Denoted 'P,' light pollution is only the former concept of whether Moon is present in the sky and under what aspect, augmented with considerations about light pollution caused by city and other artificial lights. Light pollution of the presence of Moon impacts to how deep sky objects you can reach. The 'Bertrand Laville' scale is often used (light pollution or the luminous halo caused by it has to be estimated only when in the direction of the observation):
Another scale may be from 0/10 to 10/10
Of interest too that some more factors may be estimated to be written down on the observation report, like moisture rate, temperature or the strength of wind (0 for null, 1 for about null, 2 for weak, 3 for mean, 4 for a annoying wind, 5 when wind compromises observation, for example). That translates on the observation report gabarit now, like:
The observation report, at last, is now allowing to a record of what you have observed during your observation session. Of course, that will depend upon on what celestial object you observed. Specifically, in the case of a planetary observation, some specific data will have to be transcribed -and not described here. A set of observational conditions further will concern the date, time and the duration of the observation. Time will be recorded in UT as the accuracy of a correctly set watch or computer clock is usually enough. When more accuracy, you may have to reach some local time synchronizing system as some astronomical freewares may also be of use. Additional weather data may also be added at this point as a good practice may be of caring about whether some sign hint to that weather can evolve during your observation session (like, for example, some clouds seen lingering at sunset which may possibly hinder the observation somehow, or any further remark you may deem useful):
Then comes observational data proper, with some point dedicated to more personal account like:
As far as drawing a sketch of your observation is concerned, that is usually a good practice, and may be considered mandatory. Planetary observation is always best done naked-eye and pencil-drawing as drawing trains to perceive finer details. That remark is also true generally, as when drawing a observational sketch, the eye works differently of when simply observing which brings to differently seen what is observed or to gather more or different data. When a sketch drawn, your observational report will just mention it. You will of course also consider standardizing your practice at the effect that your database be useable
At last, should you practice astrophotography, generally or should have use the technique for the object observed specifically, you will also worry to arrange fields for such data. Like the type of camera used (webcam, DSLR, CCD, etc.) and the set of data pertaining to that, the editing software included. For a webcam, for example, that should look like:
At that point you are in possession of a observational report gabarit, which could look like (which we formatted into a .txt format):
OBSERVATION REPORT

=====OBSERVATORY===================================================
Location:
Coordinates:
Altitude:
=====TELESCOPE=====================================================
Telescope, Type:
Aperture:
Focal Length:
Focal Ratio (f/D):
Mount:
Eyepiece(s) (Focal, Power Yielded, Field of View):
More:
=====OBSERVATION CONDITIONS========================================
Transparency (With Lvmn):
Seeing:
Light Pollution:
Wind:
Temperature:
=====OBSERVATION PROPER============================================
Date:
Time (UT):
Observation Duration:
Weather Remarks:
Object:
Nature:
Object Location:
Magnitude:
Dimensions:
Details:
=====ASTROPHOTOGRAPHY==============================================
Webcam Type:
Acquisition Software:
Pictures per second:
Number of Expositions:
Shutter Speed:
Number of Flats:
Number of Darks:
Luminosity, Contrast, Gamma, Gain, Saturation (in that order):
Pre-Editing Software:
Editing Software:
That could translate into such a observation report, like that fictitious one about a planet gathering, for example
OBSERVATION REPORT

=====OBSERVATORY===================================================
Location: Armentières
Coordinates: 47° 56'N latitude, 3° 2'E longitude
Altitude: 833ft
=====TELESCOPE=====================================================
Telescope, Type: naked-eye and 8x21 binoculars
Aperture: -
Focal Length: -
Focal Ratio (f/D): -
Mount: -
Eyepiece(s) (Focal, Power Yielded, Field of View): -
More: -
=====OBSERVATION CONDITIONS========================================
Transparency (With Lvmn): -
Seeing: -
Light Pollution: no Moon (was to rise East by 00:12 UT)
Wind: West 2kts
Temperature: 15 degree C
=====OBSERVATION PROPER============================================
Date: 5/23/2003
Time (UT): 07:15
Observation Duration: 0:38
Weather Remarks: twilight sky rapidly clearing from veil clouds as a band
still persisted until Venus was seen
Object: twilight Saturn, Mars, Venus, Mercury gathering
Nature: Planet Gathering
Object Location: -
Magnitude: -
Dimensions: -
Details: Venus is visible naked-eye before 9:24 p.m. local time as Saturn
and Mars are visible in 8x21 binoculars only and only after researching
them a lot. Mercury is found (only in binoculars, too) only later. Saturn
beginning to be visible naked-eye about 9:29 p.m. Mercury (idem) about
9:34 p.m. A cloud forbids to know when Mars is seen naked-eye. Alnath of
Taurus, the Bull is in the field of the gathering
a observation sketch has been drawn
=====ASTROPHOTOGRAPHY==============================================
Webcam Type: NO ASTROPHOTOGRAPHY
Acquisition Software:
Pictures per second:
Number of Expositions:
Shutter Speed:
Number of Flats:
Number of Darks:
Luminosity, Contrast, Gamma, Gain, Saturation (in that order):
Pre-Editing Software:
Editing Software:
Website Manager: G. Guichard, site 'Amateur Astronomy,' http://stars5.6te.net. Page Editor: G. Guichard. last edited: 2/14/2012. contact us at ggwebsites@outlook.com
