Soho is a cooperative European Space Agency (ESA)/NASA solar observation satellite. It's observing the Sun from an orbit which is located about the Lagrangian point L1 as it had launched by December 2, 1995, from the Kennedy Space Center aboard a Atlas IIAS rocket. It's providing professional and amateur astronomers with data, of them daily pictures. These daily Soho images, found on the SOHO website, are taken through various instruments. They may help building a comprehensive view of the Sun, starting at the photosphere, this surface by which our star is seen in the visible wavelengths of the spectrum, up to the corona. SOHO helped revolutionize our understanding of the Sun's interior and complex atmosphere. all pictures SOHO courtesy SOHO daily pictures


The photosphere is shown by the "MDI continuum" and the "MDI magnetogram" pictures. MDI stands for "Michelson Doppler Imager". The orange picture is almost like the Sun is looking naked-eye, limb-darkening excepted. The usual photosphere activity is shown (sunspots, faculae), as the magnetogram is showing areas of magnetic activity (white indicates a north polarity as black a south one). Most of such areas are linked to sunspots seen in the visible. Some are not associated with any sunspot however. Such areas are useful too to either track a sunspot which decayed or to anticipate where one sunspot might develop. The temperature at the photosphere is 6,000° K


The "Extreme ultraviolet Imaging Telescope" (EIT) is providing four color images. The EIT is imaging the Sun in the extreme ultraviolet as each image pictures one layer of the inferior strates of the corona (or, which is about the same, all the pictures are about the upper chromosphere). The picture are ranging from the lowest, to the highest level, in this order (the higher a layer, the hotter it is):


The "Large Angle Spectrometric Coronagraphs" (LASCOs) are coronagraphs, that is an occulting disk which creates an artificial eclipse. Such a tool, available for ground-based instruments too, is allowing to see the features which are seen during a total solar eclipse. The LASCO pictures are showing the corona with the coronal streamers, those nearly radial bands. Occasionally, a Coronal Mass Ejection (CME) can be seen being expelled from the Sun and crossing the field of both coronagraphs. The LASCO C2 (red picture) is showing the inner corona up to 5.25 million miles (8.4 million km) as the LASCO C3 (blue picture) is encompassing 30 million miles (45 million km), that is about half the orbit of Mercury. The white circle on the LASCO images is the actual size of Sun's disk as the dark pole is the is the occulter disk's pole. The LASCO C3 images are allowing too to see the background stars as, celestial mechanics permitting, both inferior (Mercury and Venus) and superior (starting at Mars) planets may be seen at their conjunctions
->SDO Renewed Solar Visions!
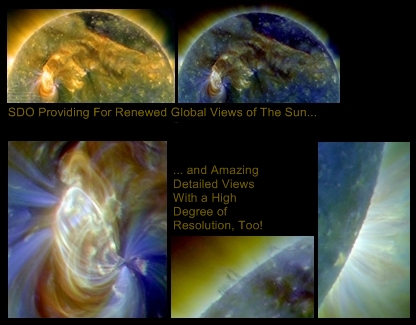 | click to some renewed SDO visions. picture NASA/SDO and NASA/SDO/AIA |
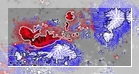 | A vector magnetogram by SDO, with blue showing where magnetic fields rise up and red where returning to the surface. picture site 'Amateur Astronomy' based upon a picture courtesy NASA |
->Goddard Space Flight Center's Community Coordinated Modeling Center
The Community Coordinated Modeling Center, in NASA’s Goddard Space Flight Center in
Greenbelt, Md., with four large plasma screens on the wall showing colorful basketball-sized images of the Sun in real time or images featuring data from particles as they flow from the Sun to the Earth, or a map of the Sun’s magnetic fields, constitutes the heart and soul of Space Weather Services at NASA, the team that
keeps tabs on the Sun’s activities for the entire Agency. The center is working, among others, with the Air Force Weather Agency (AFWA), which incorporates
NASA's information with other data into their own forecasts. In turn, AFWA
regularly sends valuable information to Goddard to help test their models. Such modeling and observing functions allows the USA to have some powerful tools to predict space weather and potentially damaging solar events, as far as the Earth is concerned
